Background:
There are a lot of repeatable process (or called life cycles, using the circular flow diagram) in our business activities. Software development life cycle is the most famous one during the application development process. There is a simple method to draw such circular flow diagram in PowerPoint.
Guided illustration:
The below steps illustrate how to draw the circular flow diagram:
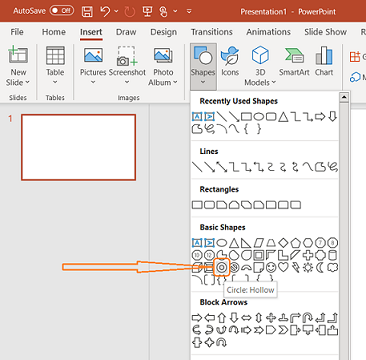
Figure 1. Select the “Insert” menu, the click the “Shapes”, select the Circle: Hollow.
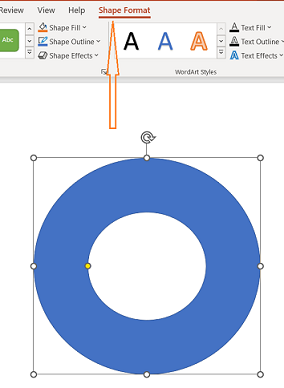
Figure 2. In “Shape Format”, draw the circle (a donut shape).
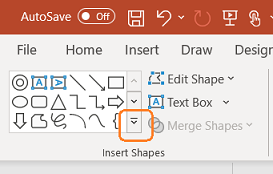
Figure 3. Add another shape, click the orange rectangle to drop down all the shapes.
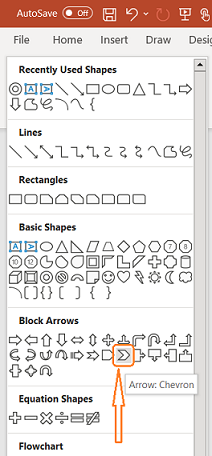
Figure 4. Select the Arrow: Chevron.
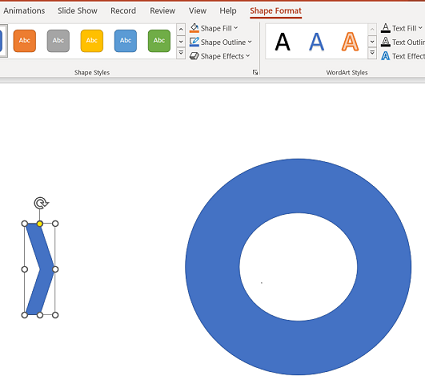
Figure 5. Draw the arrow.

Figure 6. Adjust the arrow size, make it thinner.
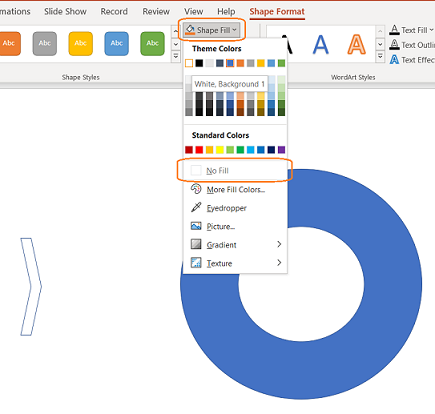
Figure 7. Set the “Shape Fill” to “No Fill”, make the arrow white in color (it is not transparent).
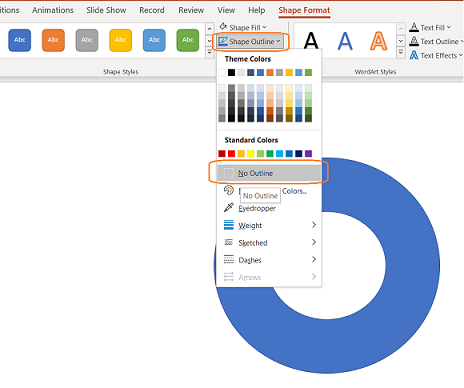
Figure 8. Set the “Shape Outline” to “No Outline”, white arrow without outline seems disappeared.
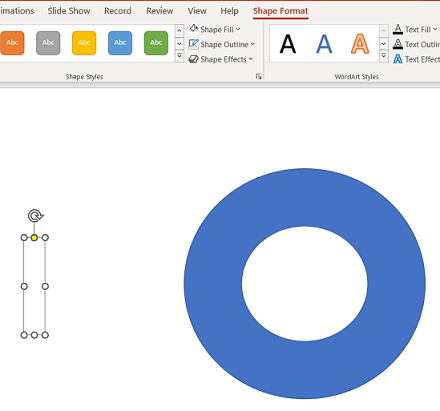
Figure 9. The outline and fill of arrow are changed to white in color, the surrounded highlight appeared after selected the arrow.

Figure 10. The white arrow appeared again, move it to cover the circle.

Figure 11. Adjust the arrow to make the arrow sharper.

Figure 12. Copy the arrow and place it surrounds the main circle.
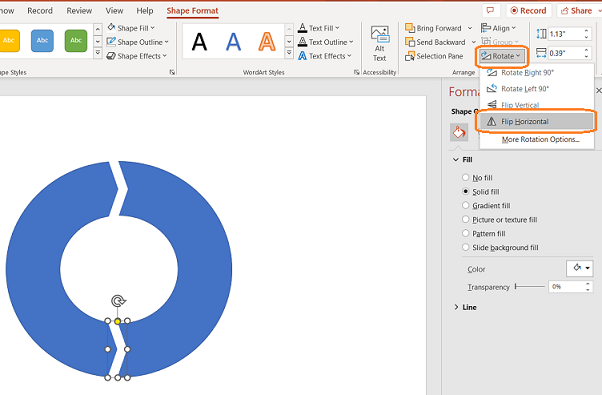
Figure 13. The direction of arrow is point to right, change it to point to left. Go to “Rotate” then select “Flip Horizontal”.
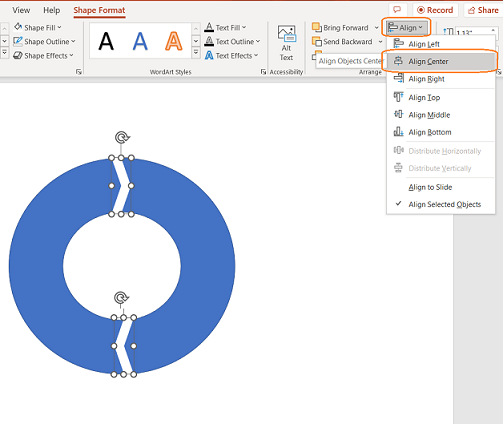
Figure 14. There is a convenient way to align the drawing, go to “Align” then select “Align Center”.
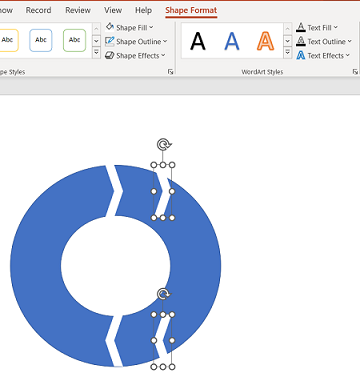
Figure 15. Copy the draw and paste them repeatedly.
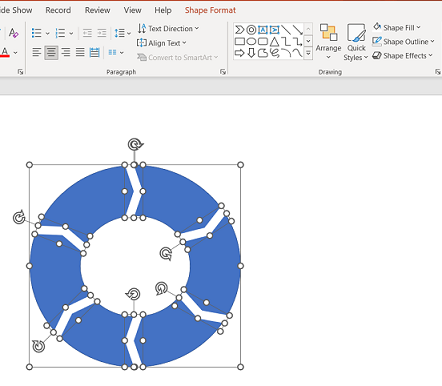
Figure 16. After place all the arrow, select them together with the circle.
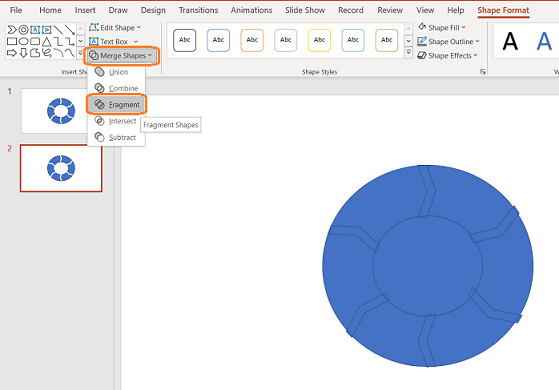
Figure 17. In the “Shape Format”, select the “Merge Shapes” command. Then click the “Fragment” to break the selection.
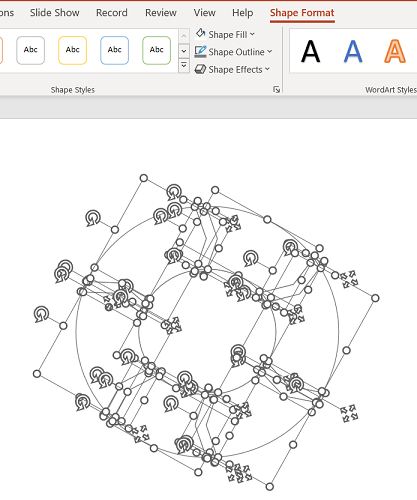
Figure 18. All drawing break to many fragments.
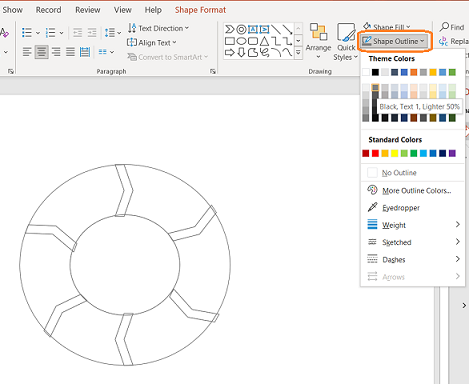
Figure 19. Select “Shape Outline” to make the fragments more visible.
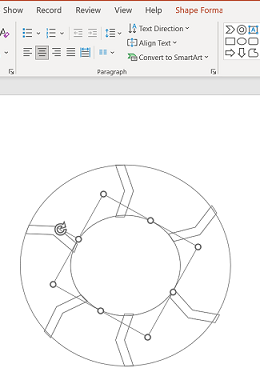
Figure 20. Select the center circle and then press the delete key to remove the inner circle.
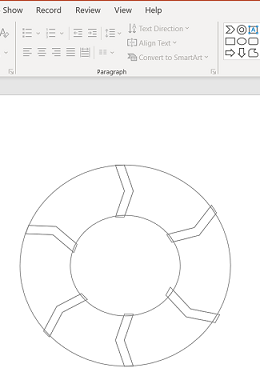
Figure 21. The inner circle is removed (it is not visible because the main circle has the inner outline).
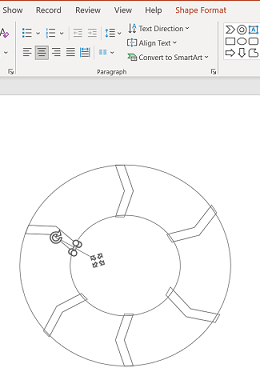
Figure 22. Remove “glitch” of the arrow, the best practice is the arrow fully surrounded with the circle.
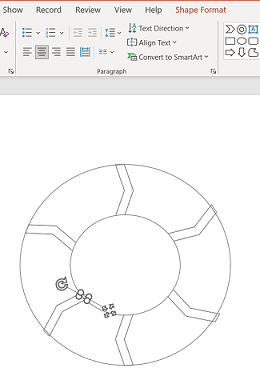
Figure 23. Remove all “glitch” of the arrow until the circle shape is cleared.
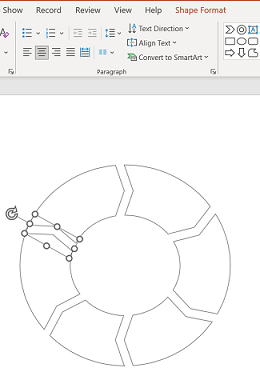
Figure 24. Delete all the arrows, the circular flow is now revealing.
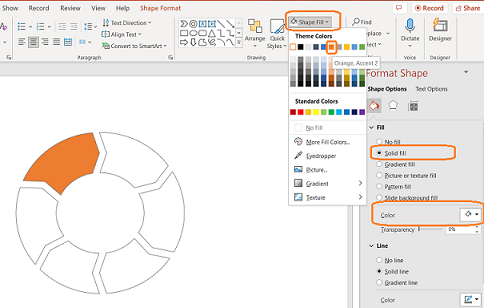
Figure 25. Fill the color of each circular flow element. It can be select “Shape File” and click the color in the menu bar. It also can be formatted in “Format Shape”, “Solid fill” then select the “Color”.
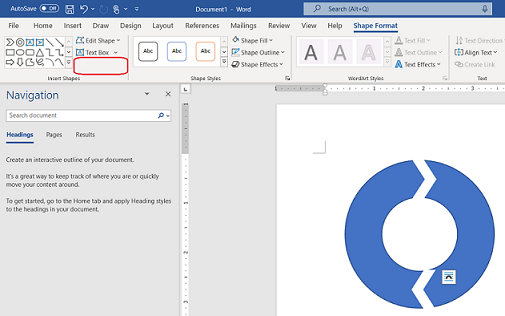
Figure 26. Microsoft Word can create the shape, but the “Merge Shapes” command does not exist (refer to Figure 17).
Conclusion:
Draw the circular flow diagram in PowerPoint is straight forward. The main command is break down all drawings to fragments.